Tracing Node.js application with OpenTelemetry & Jaeger UI
In this tutorial I will demonstrate how to trace and instrument Node.js application with OpenTelemetry.

Why do we need tracing?
If you are running micro-service apps you able to capture the traces of request and show the information about the application like how request came and time taken to return the response also helps to analyze your service performance and behavior
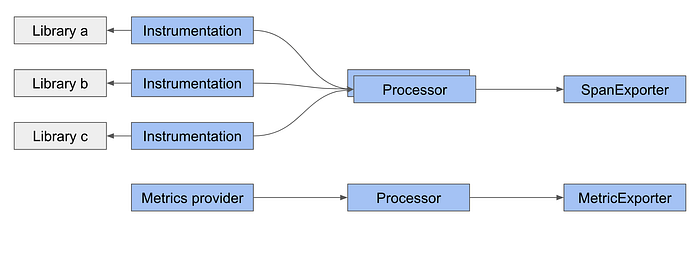
We will instrument this application with OpenTelemetry’s Node.js client library to generate trace data and send it to an JaegerExporter Collector. The Collector will then export the trace data to Jaeger UI to visualize the time series chart.

Install JaegerUI
To run JaegerUI in local use below docker command.
docker run -d --name jaeger \
  -e COLLECTOR_ZIPKIN_HOST_PORT=:9411 \
  -p 5775:5775/udp \
  -p 6831:6831/udp \
  -p 6832:6832/udp \
  -p 5778:5778 \
  -p 16686:16686 \
  -p 14250:14250 \
  -p 14268:14268 \
  -p 14269:14269 \
  -p 9411:9411 \
  jaegertracing/all-in-one:1.29
Go to http://localhost:16686/search to use Jaeger

Install OpenTelemetry Packages
Next step is to setup OpenTelemetry packages to our application.
npm install @opentelemetry/api @opentelemetry/auto-instrumentations-node @opentelemetry/exporter-collector @opentelemetry/exporter-jaeger @opentelemetry/instrumentatio @opentelemetry/plugin-express @opentelemetry/plugin-http @opentelemetry/propagator-ot-trace @opentelemetry/resources @opentelemetry/sdk-node @opentelemetry/sdk-trace-base @opentelemetry/sdk-trace-node @opentelemetry/semantic-conventions @opentelemetry/tracing --save-devAdd the above packages to provide instrumentation of service requests across ExpressJS, http and the library modules used, we don’t need to add anything extra in our application code apart from adding a tracer.
Create tracer.js file to node application
A tracer.js file takes care of tracing setup and allows to capture the request with following snippet.
To push the trace to Jaeger provide your host with below url, Jaeger component exposes the metrics scraping endpoint on the admin port
http://localhost:14268/api/tracesThe above file takes care of instantiating the trace provider and configuring it with a trace exporter of our choice. To send trace data we are using JaegerExporterCollector. To verify the trace data whether spans are collected use `ConsoleSpanExporter to print in console
Instrumentation setup
There are two ways to setup instrumentation automatic and manual, to instrument express traces we will use new HttpInstrumentation(),
new ExpressInstrumentation()
Please read about this module here
Include tracer to NodeJs application
const { init } = require('./tracer')
const api = require('@opentelemetry/api')init('demo-node-service', 'development') // calling tracer with service name and environment to view in jaegerui
The service name will be used to filter our tracing logs in the UI

Consider the below application as existing micor-service we are calling tracing config here to initialize.
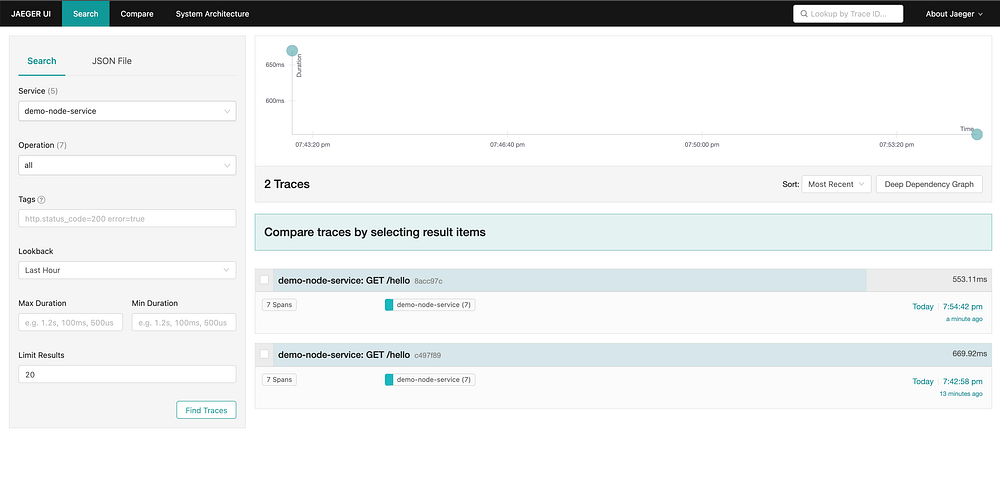
Lets run our service and call api `http://localhost:3000/hello` see the traced logs in JaegerUI,
JaegerUI: http://localhost:16686/search

We are able to see the tracing

As you expand the first tree we can see the custom message we send from the code can be viewed below

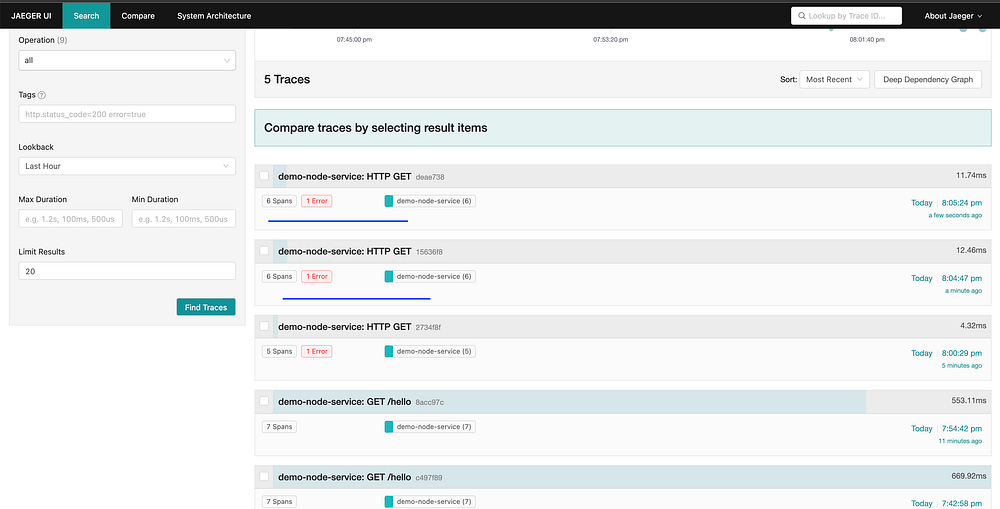
Even if the api has error those span also gets captured

Include the tracer in your micro-service application and invoke the api calls to view the complete traces, also invoking from one service to other service complete logs are instrumented automatically.
Conclusion
The instrumented application traces can used to analyse the backend performance also used to debug api success and failure easily with Jaeger UI
The same typescript version can be viewed here
